Sample image
Kuridhika kwa wazazi
Mtazamo wa Mzazi
subtitle
Wangependekeza
48
%
65 parent responses (2021-2022)
Majibu65
Mwaka wa utafiti2021-2022
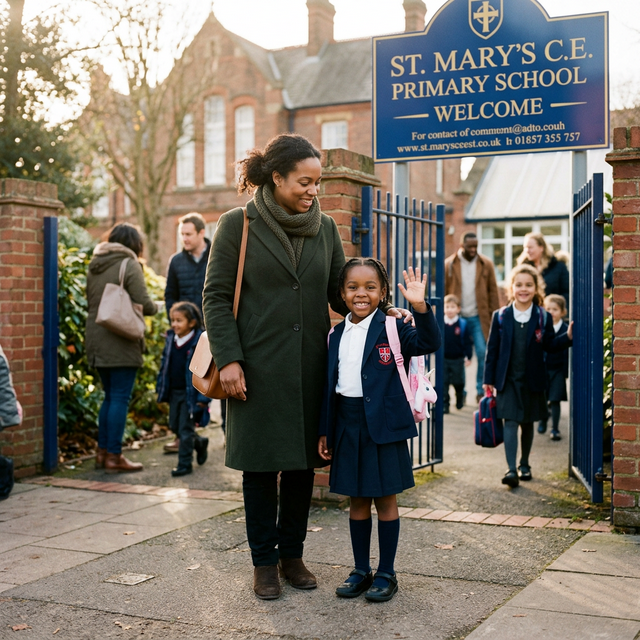
💬48% of parents would recommend this school — overall parent satisfaction is below national averages across most measures.
Comparing against National averages (17,982 schools)
❤️ Key Parent View Metrics
Based on 65 Ofsted Parent View responses · Card colour reflects sentiment
😊65 responses
77%
Happy at School
National: 91.0%▼ -14.0%
🛡️65 responses
80%
Safe at School
National: 91.7%▼ -11.7%
⚠️65 responses
N/A
Bullying Reported
👍65 responses
48%
Would Recommend
National: 55.6%▼ -7.6%
📊 Response Breakdown — All 3 Questions
Percentage of parents who agree or strongly agree
Data sourced from Ofsted Parent View — 65 parent responses (2021-2022). Percentages represent parents who selected "Agree" or "Strongly Agree". Visit Ofsted Parent View →
 Coningsby St Michael's Church of England